
A Point & Figure Chart (P&F) is a unique type of charting technique that is used to identify and track price movements in tradable assets like stocks, commodities, and currencies. The underlying philosophy of the P&F charting technique is that what really matters is a price's direction, rather than its magnitude. It also helps to identify trends in the market that may not be visible in other charting techniques.

What is a P&F Chart?
At its core, the P&F charts consist of ‘boxes’ which represent the price movement of a stock over a given period of time, usually 1, 3 or 10 points in price. For example, if the stock went from $50 to $51 in a single day, that would create a ‘box’ on the chart. The chart then looks for patterns of trends in the boxes, such as a group of boxes that all move in the same direction (up or down). If the boxes continue moving in the same direction for a certain amount of time, then they form a ‘volume’ of boxes which signals a strong trend.
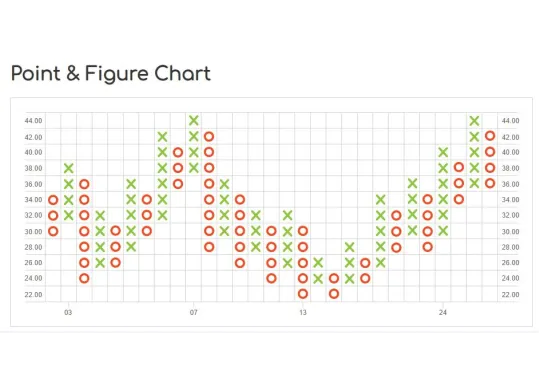
Boxes and Volumes
In terms of charting technique, P&F charts rely on simple horizontal and vertical lines, as opposed to the more complex line charts and candlestick charts that are commonly used. The primary indicator used with P&F charts is the cumulative volume, which measures the total number of boxes in a trend. This helps traders to identify long-term trends that may not be visible in other charting techniques. Additionally, P&F charts can often provide early signals of a trend reversal.
Charting Technique Basics
P&F charts can also be used to assess the momentum of a stock or security. The cumulative volume is a key metric to track for this purpose, as it provides a good indication of the financial strength of the underlying company and how it is trending over time. If the cumulative volume rises or falls significantly within a given period of time, it may be an early indication of a trend reversal or potential support/resistance levels.
Unlock the power of P&F charts to better understand market trends!
Assessing Momentum
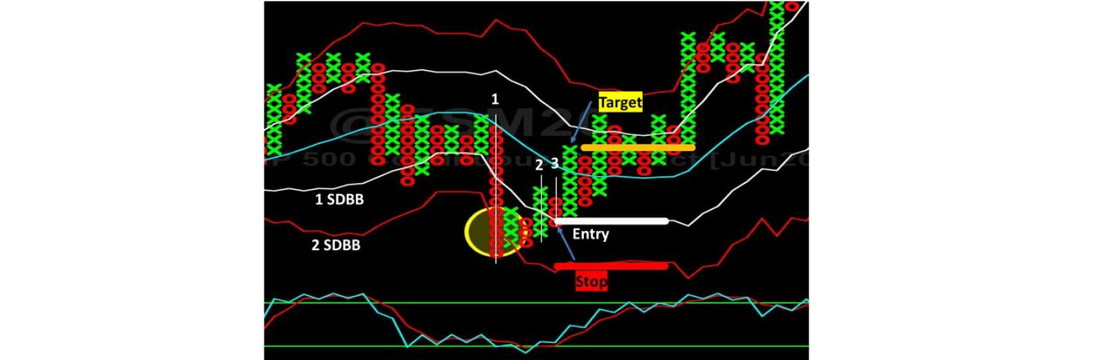
Despite its simplicity, P&F charts remain one of the go-to charting techniques for many traders. It’s easy to learn, reliable, and can often provide early warning signs of major market moves. By combining P&F charts with fundamental and technical analysis, traders can better assess the overall market conditions and make informed trading decisions.
In conclusion, Point and Figure Charts are a reliable charting technique that can help traders identify market trends, assess momentum, and make informed trading decisions. By combining its elements with technical and fundamental analysis, traders can gain deeper insights into the market and craft effective strategies for successful trading.